September 10, 2019
Better Living through Microsoft Word Tables, Part 3: Amazing Table Secrets
The Tables function in Microsoft Word is one of its most useful features! Unfortunately, it’s also one of the most often misused (or even ignored). If you’ve ever been frustrated or baffled by someone else’s table-related behavior, or if you’ve ever had trouble with tables yourself (and haven’t we all?), this series is for you!
In Part 1, we covered the fundamentals of creating, manipulating, and formatting tables. In Part 2 and Part 3, we get into some more advanced tips and tricks!
Nesting: Good for birds, bad for tables
Versions of Microsoft Word since 2010 have included the ability to “nest” tables—that is, to place one table inside another. Why? We have no idea.
We strongly recommend not using nested tables, both because they make tables unpredictable, chaotic, and difficult to work with and because anything you can achieve with nested tables, you can probably do more easily without them!
What if you inherit a file from someone else that contains nested tables? Here’s how to get rid of them:
- Make sure you’re working with both Gridlines and Nonprinting Characters showing, so that you can see what’s really happening in your document. (Turn on gridlines via Table Tools > Layout > View Gridlines; display nonprinting characters by clicking the ¶ button on the Home tab.)
- Select only the nested table (if there’s more than one, select one at a time), like this:
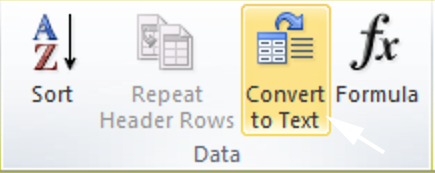
- On the Table Tools > Layout tab, click Convert to Text:
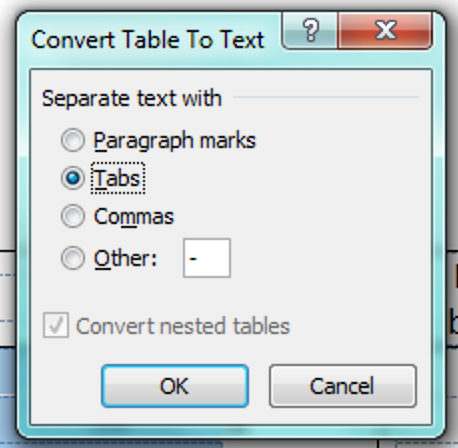
- Select your desired divider from the Convert to Text dialog:
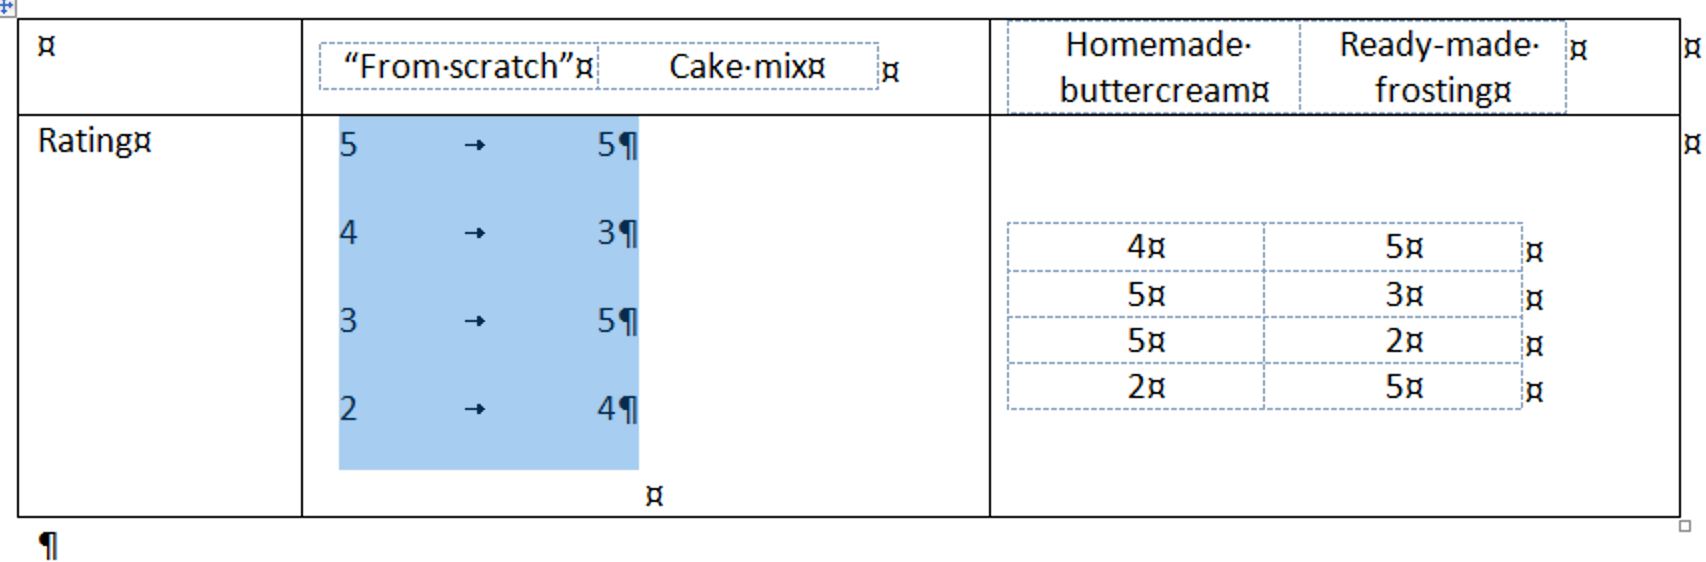
- Click OK. Here’s the result of choosing Tabs:
- Repeat as necessary for additional nested tables.
From here, you can add rows and split columns to create the table structure you want.
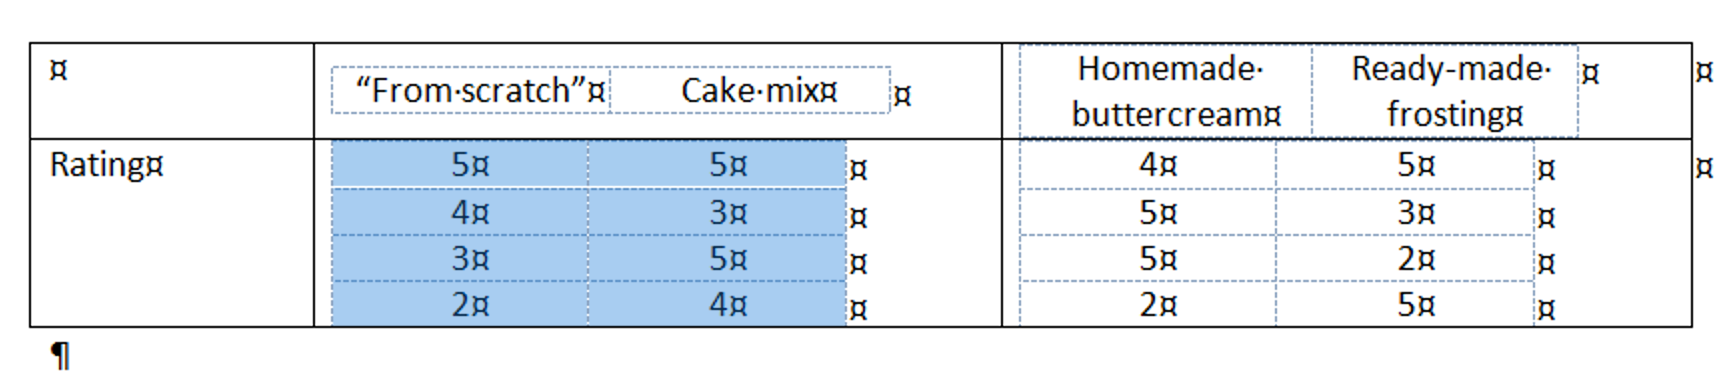
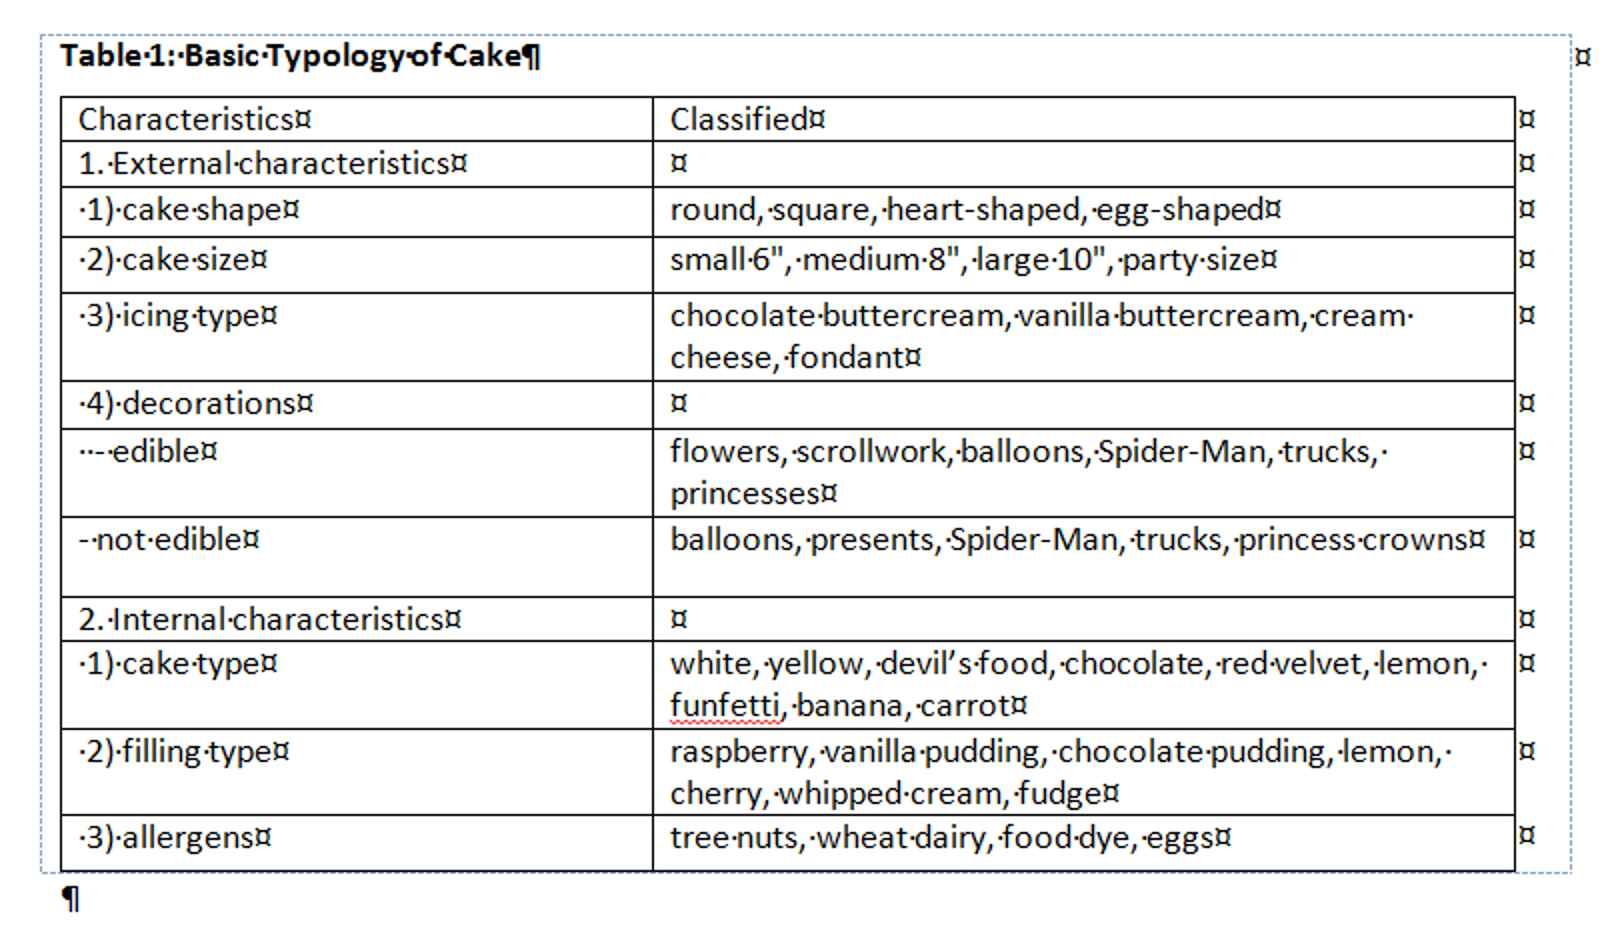
Some nested tables follow a different pattern, where the table content is all in one table that’s nested inside another, and the outer table is acting as a text box, like this:
In this case, your best bet is to follow these steps:
- Use Table Tools > Layout > Select > Table to select the inner table.
- Use Ctrl-x (or right-click, then select Cut from the pop-up menu) to cut it to your clipboard.
- Now that the outer table contains nothing but text, click inside it and use Table Tools > Layout > Convert to Text. (If there’s no additional text inside the outer table, you can simply delete it!)
- Decide where you want the table to go (in the example above, directly below the title), and paste it there.
→ Tip: eXtyles users, rejoice! eXtyles will warn you during Activation if a table in your file contains one or more nested tables, and will identify which table is causing the problem so that you can take a look before proceeding.
The repeating header row
Tables in scholarly manuscripts can be really long, sometimes running to two or three or even more pages; to make them readable, you need the header row/s to appear at the top of each page.
To make this happen, you could copy the header row from the first page and paste it in at the top of each subsequent page—but you shouldn’t! Not only is it a lot of extra work now, it also creates more work later: subsequent header rows added in this way can be pushed down or pulled up to inappropriate places by changes earlier in the document, they have to be updated by hand whenever a change is made to the original header, and they can also sneak through editing and production to show up on page proofs or preprints!
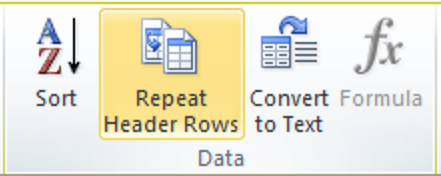
Fortunately, there’s a much quicker, easier, and less risky way to make the same header display on each subsequent page of a table: just click anywhere in the header row of your table, go to Table Tools > Layout, and click Repeat Header Rows:
These repeated header rows, rather than being separate rows of the table, are simply displayed copies of the original header row at the beginning of the table. This means they will update automatically with any change you make to the original header! It also means that they appear, disappear, and move appropriately as content or formatting changes are made to the table. To turn this feature off, just click the Repeat Header Rows button again to deselect it!
Aligning on the decimal
Suppose you have a table full of data, represented using varying numbers of digits. Obviously you want to align all these figures on the decimal, and over the years we’ve seen an amazing variety of attempts to do this, including right-aligning or centering the whole column; adding tabs or spaces; and adding leading or trailing zeroes, then changing the font color to white to make them invisible. (Spoiler: this never ends well!)
First, make sure you have your Ruler showing!
Fortunately, there’s a Word feature for that! More precisely, there’s a tab for that. Here’s how to make it work for you:
- Make sure you have your Ruler showing!
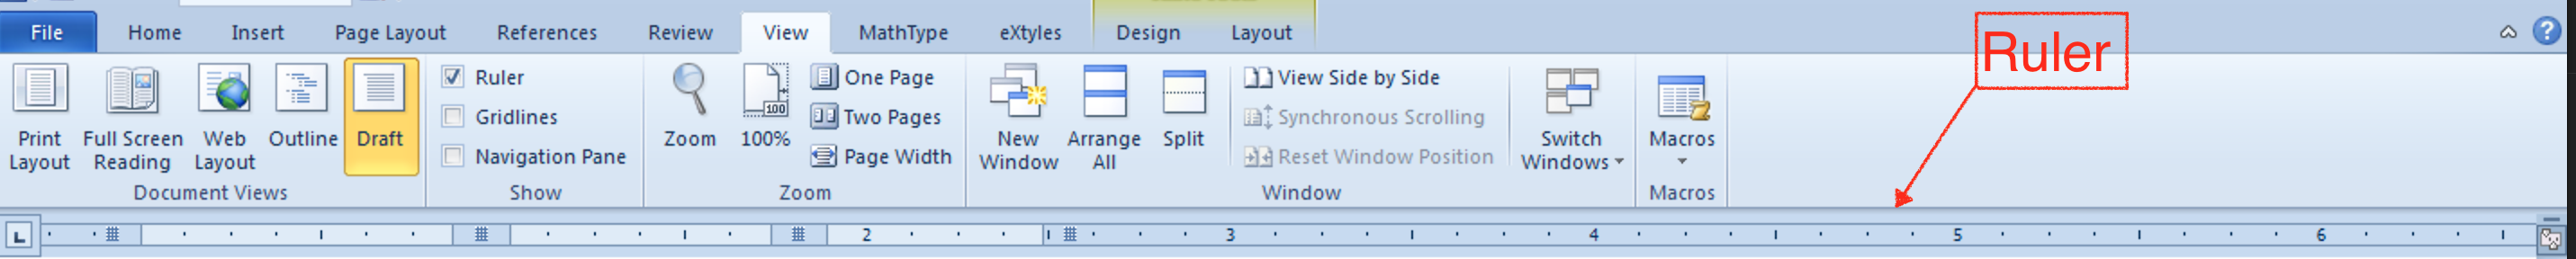 If you don't see the Ruler across the top of your Word screen, either click the View Ruler icon at the top of the vertical scrollbar:
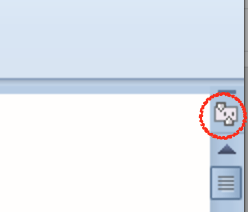 or go to the View tab and check the Ruler box.
 - Once the Ruler is showing, select the table cells you want to decimal-align and look for the Tab Indicator at the top left-hand corner of your screen (at the other end of the Ruler):
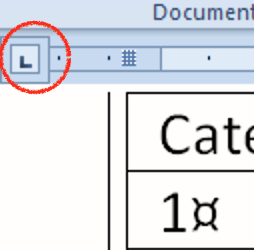 By default, the Tab Indicator shows a left tab (the little L shown above). By clicking on this button, you can toggle through other types of tab: the Center tab (an inverted T-bar),
 the Right tab (a backwards L),
 and the Decimal tab (an inverted T-bar with a dot):
- Once you get to the Decimal tab, go back to your Ruler and click at the point where you want the decimals to align.
- An inverted T-bar with dot will appear on the Ruler, and the content in the selected table cells should now be aligned on the decimal.
- If you don't like how it turned out, click and drag the tab indicator on the Ruler until you do!
What tables are for (and what they are NOT for)
When should you use a table, and when should you choose some other way of conveying information?
Of course, you should use tables for tabular data, including descriptive statistics, survey results, location data, and regression analyses. Tables are also essential for presenting the results of meta-analyses.
Tables are good for lots of purposes! But not for everything. Here’s a brief list of things that you should not put in a table:
- The title of your table
- Table footnotes
- Your reference list
- The author list of your article
- Images, figures, maps, illustrations, graphs, charts, or drawings (or their captions)
- Poetry
- The entire contents of your document (no, not even if you think it looks much better that way)
When in doubt, ask yourself: Why do I want to put this material in a table? If the answer is I think it looks better that way, consider other formatting options. For example, Word lets you vary line spacing, leading, alignment (justification), and indention; create footnotes, endnotes, and a wide variety of single- or multi-tiered lists; divide text into two or more columns; and create or import many kinds of graphic elements.
Link: https://www.edifix.com/blog/better-living-through-microsoft-word-tables-part-3-amazing-table-secrets